
Understanding Renewable Energy using Alternative Data: United Kingdom

The source
In 2021, total Greenhouse Gas Emissions across the United Kingdom were 5.2% lower than in 2019. Governments and organizations worldwide have encouraged people to adopt clean energy, highlighting the resultant global warming and depletion of conventional sources. Being accounted for a high carbon footprint, the UK Government and people have been more conscious about their carbon footprint than ever. The UK’s carbon footprint is between 6 tonnes to 10 tonnes per person. This has been a significant concern for the government and the people; hence, a steady transition has been witnessed toward adopting gas and renewable energy.
This transition is supported by the fact that we can calculate present solar generation capacity across cities and the distribution of other sources over this clean energy network. The sophistication of this metric allows us to minimize our dependence on fossil fuels as a source of energy.
What energy sources are actually used?
The UK’s sixth carbon budget highlighted the goal of reducing carbon emissions by 78% by 2035. This means the government has been making efforts to decarbonize its present energy supply. And as a citizen, people have the right to understand where their energy is coming from. Presently, the distribution of energy sources are as follows:
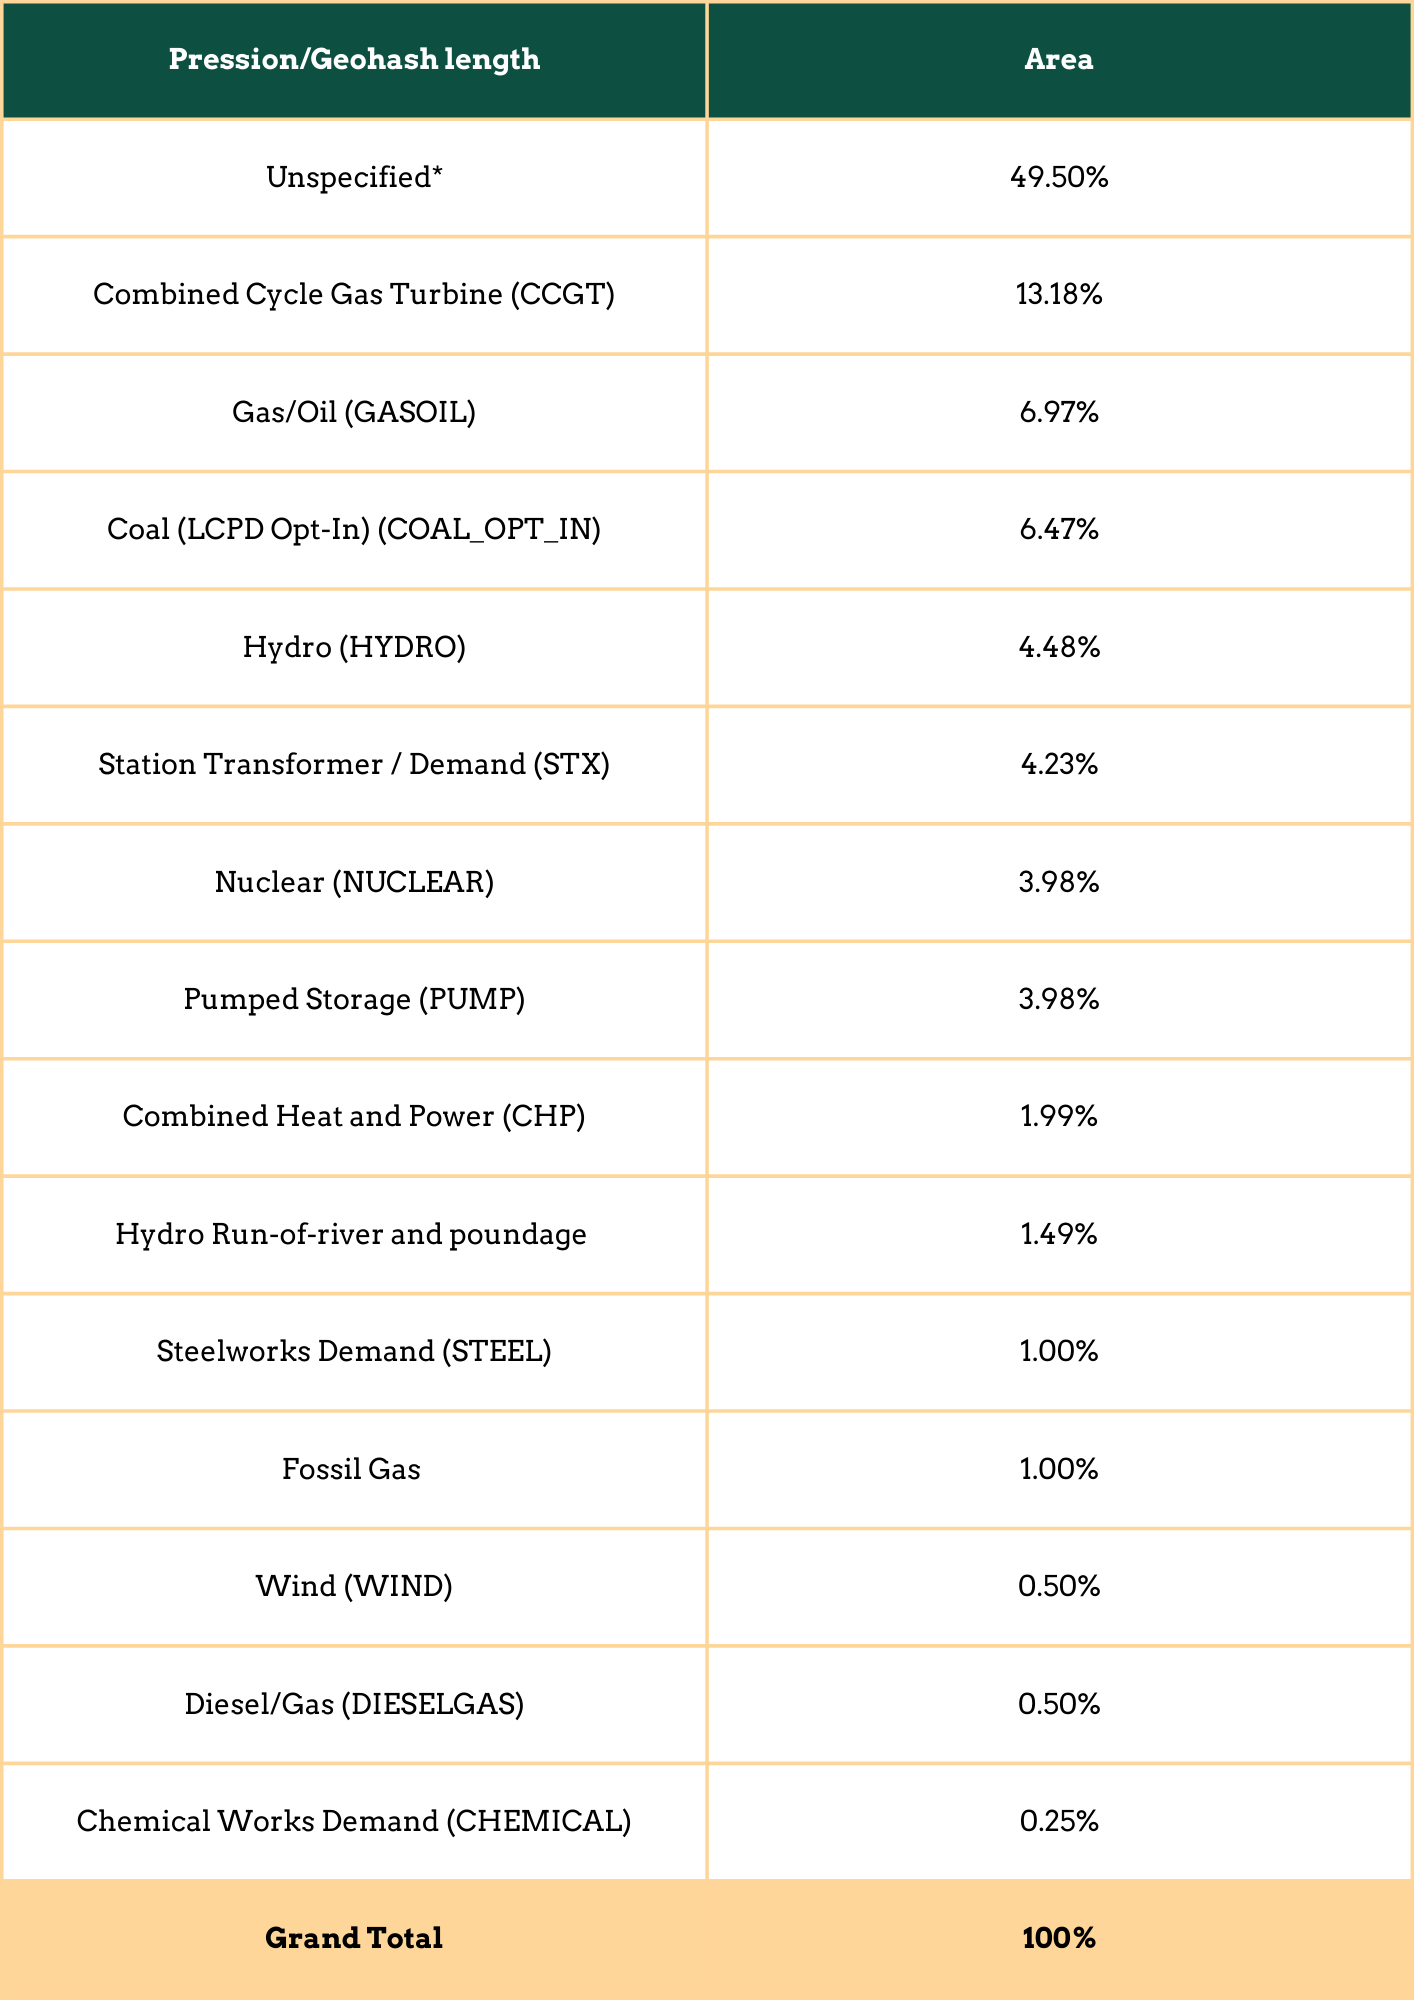
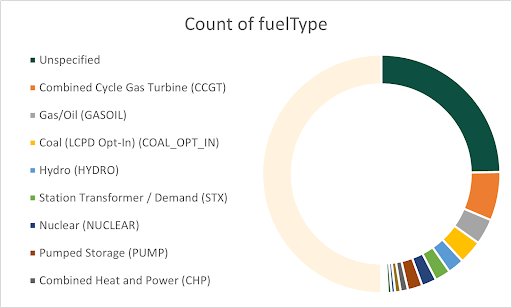
As seen, the top four recognized sources of energy are
- Combined Cycle Gas Turbine (CCGT)
- Gas/Oil
- Coal
- Hydro
As mentioned above, numbers showcase the UK’s steady transition towards gas and renewable energy. When aware of the energy source, the numbers allow us to understand where we are and, based on our goals, where we have to reach. Indeed, these sources aren’t perfect either, and they have barriers.
Coal – Being a non-renewable resource, coal is not only harmful to the environment but also is a depleting resource.
Gas – It’s always a challenge to control gas, and it isn’t a switch-on/off resource which can be turned off whenever someone wants. Plus, the heat impacts the environment.
Hydro – The infrastructural costs are primary barriers, and their impact on the neighboring areas is also harmful.
Solar – Capital costs and uncertain presence of sunlight
Only to list a few of them, if we comprehend this distribution of non-solar and solar channels, we can take a step toward optimizing the energy resource we need by not misusing them. This map portrays the distribution of solar and non-solar channels during two days of February, and we can understand at what time of the day, which energy source is used, and their capacity.
The red spots show the active non-solar energy sources and the yellow spots are the solar energy sources.
Capacity
As we move towards a clean future, we need to understand our capacity and optimize the energy source we need to use. Like in the United Kingdom, our identified solar energy sources have a capacity of 38558.20941 (unit) out of 174298.1894 (units).
As we can identify which energy resource we can optimize, our ability to predict the amount of power generated also helps minimize the dependence on non-solar energy.
The UK has a temperate climate. While understanding the demand, we know that we would produce more solar power during summers, which might be a challenge in Winter. This calculation not only helps the government but also, for instance, as an electricity generation company, if you are aware of the amount of power generated by solar, you won’t have to worry about running the plant on bright days and optimizing the same for cold days.
Conclusion
Climate change and global warming concerns have always been around, and people are getting more mature with their decisions. Government is conscious of the carbon footprint, and with the ESG mandate in place, industries are keeping a check on their “E” vertical. ESG mandate demands these companies and governments to establish public standards, which requires quantifying environmental impacts. While this metric is intangible, we at Data Sutram are working towards this sophisticated measurement. As we step toward predicting the power and quantifying the capacity building, using alternative data can surely aid us in aligning our goals and facilitating responsible decision-making.